第15章 生成数据
15.1 安装matplotlib
输入如下命令没有任何错误信息说明安装成功
15.1.5 matplotlib画廊
15.2 绘制简单的折线图
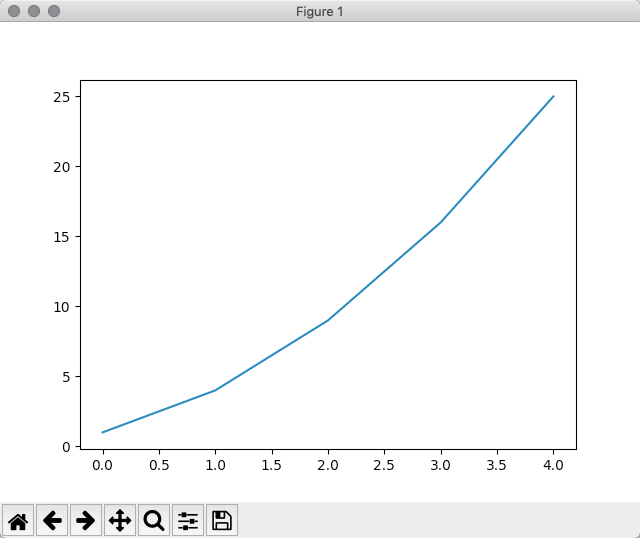
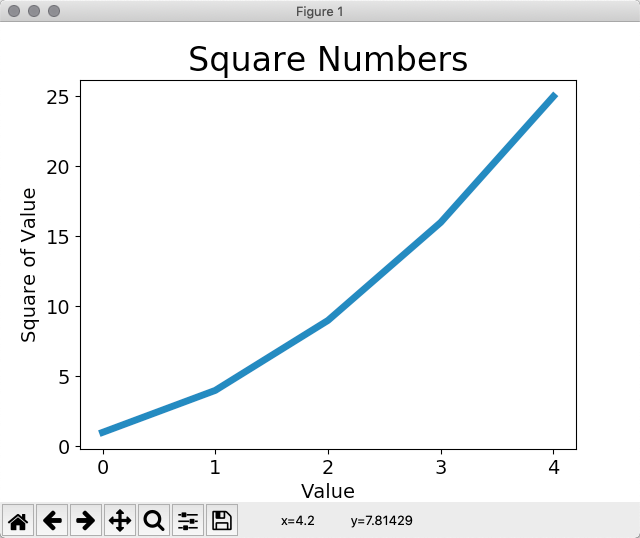
15.2.1 修改标签文字和线条粗细
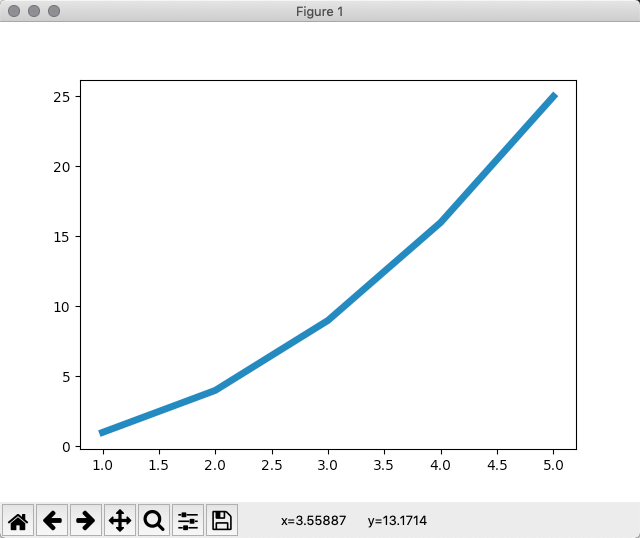
15.2.2 校正图形
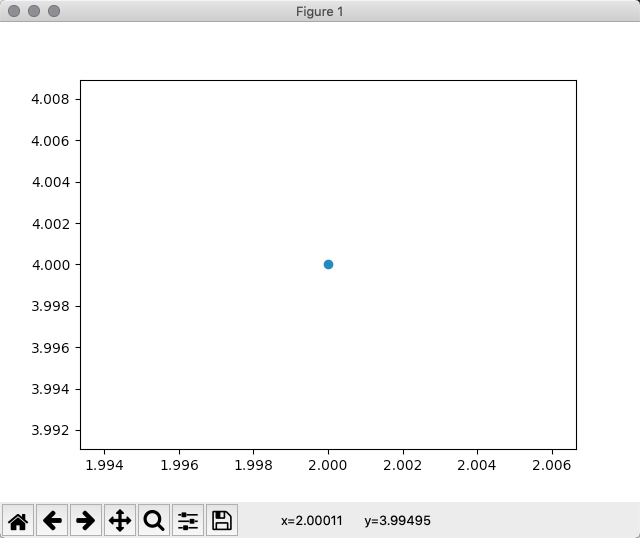
15.2.3 使用scatter()绘制散点图
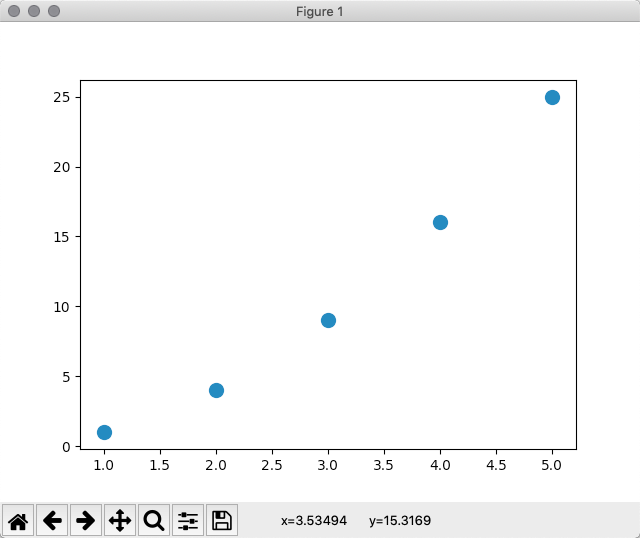
15.2.4 使用scatter()绘制一系列点
15.2.5 自动计算数据
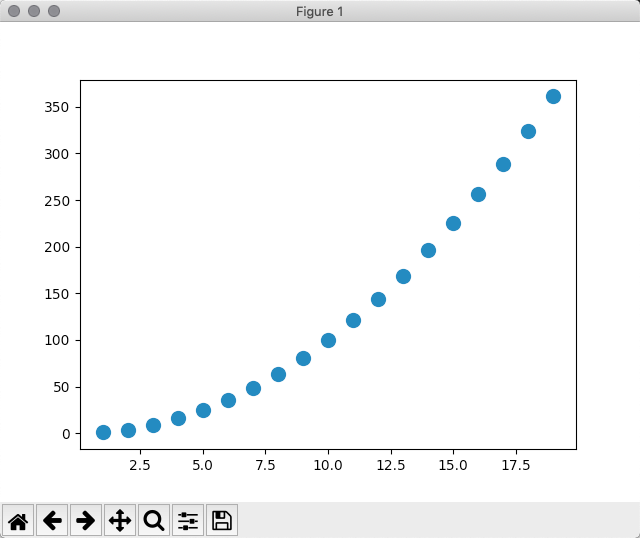
15.2.6 删除数据点的轮廓
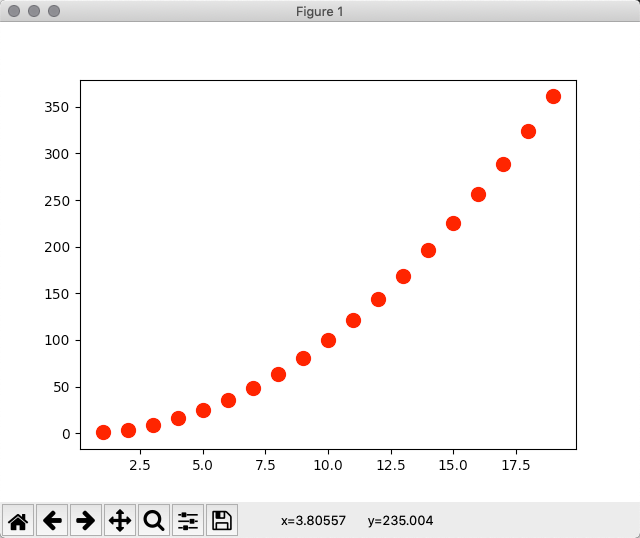
15.2.7 自定义颜色
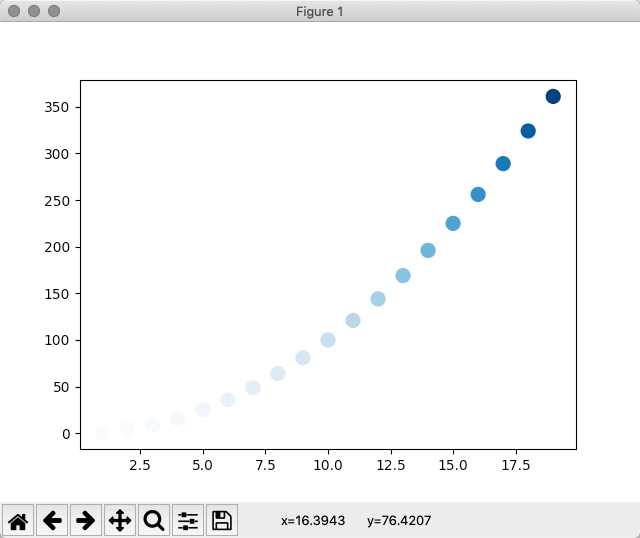
15.2.8 使用颜色映射
输入如下命令没有任何错误信息说明安装成功